HEC-RAS in Three Dimensions
Now this is the kind of post that gets you on The RAS Solution! Cutting edge creative solutions…
An advantage of running a step-down scheme hotstart run is the ability to spatially evaluate stability issues with difficult reaches. One of the elemental features of the step-down scheme is the artificially raising of the downstream boundary during the hotstart simulation to “drown-out” the reach and effectively create a very stable environment. During the hotstart simulation period, problem areas will identify themselves as the water surface elevation slowly lowers itself into a realistic solution. This is a great way to diagnose instability issues. However, if you have bridges or culverts, drowning-out the reach creates water surface elevations that are much higher than the normal water surface range you’d expect at those bridges, and a normal set of HTab parameters may not work well during the initial period of your hot start simulation. I’m speaking specifically about the “Head water maximum elevation” HTab parameter that is required at bridges and culverts. The figure below shows the problem that occurs with a normal headwater maximum elevation during a step-down hotstart run. Notice the flat pool downstream of the 3rd bridge, followed by a severe drop in water surface elevation. In a good hotstart simulation, the downed-out reach should show a consistently level water surface elevation. Ultimately this hotstart simulation crashed.
At first, it seems like an easy fix: Simply increase the head water maximum elevation for the affected bridge to an elevation around the “drowned-out” condition. In this case, I increased the head water maximum elevation to 350 ft, which is equal to the initial drowned-out elevation set at the downstream boundary. I make this fix and the profile looks good and the hotstart simulation runs to completion without errors. The figure below shows 6 profiles using the hotstart simulation with a step-down scheme. Notice the level pools as the water surface steps down to the true initial conditions.
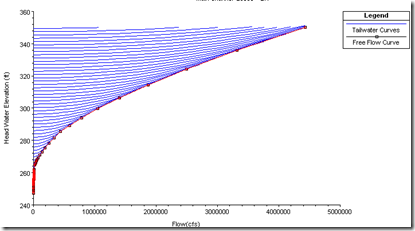
Now that we have a good, stable hotstart run, switching to the real plan should be seamless, right? Actually, now that I’ve expanded the range of computation points for the rating curve at the 3rd bridge by using an artificially high head water maximum elevation, I’ve lost a lot of resolution in my rating curve for my real plan-particularly down in the range of real water surface elevations. Notice in the figure below that my expanded HTab curves go up to elevation 350 ft. Since I have a finite number of submerged curves, and points on the surbmerged and free flow curves, I have a loss in resolution in the range of realistic solutions (namely down in the 250 ft range).
 The real plan then crashes when the front end of flood wave reaches the 3rd bridge. The figure below shows error at the upstream end of the bridge that leads to the instability-and ultimately the crash.
There is actually a very easy fix. Simply change the headwater maximum for the “real” plan to a realistic maximum water surface elevation for that bridge. In my case, I reduced it from 350 ft to 270 ft. If you read through the hotstart posts in this blog, you’ll notice that I say any change in geometry will require a re-run of the hotstart plan, before running the real plan. To stabilize the hotstart plan, you’d have to put the headwater maximum elevation back to 350 ft, and then we’d be back to where we started. However, this is a rare exception to the rule. Luckily for us, changing the headwater maximum does not prompt HEC-RAS to want to re-run the hotstart plan. So we are free to change the HTab parameters at bridges for the real plan. Just make sure that if you DO re-run the hotstart plan, you change the headwater elevation back to the “drowned-out” condition (350 ft). Then “re-change” it to the realistic condition for your real plan (270 ft). It also helps to maximize the number of submerged curves, and the number of points on the free flow and submerged curves. This too provides more resolution. The figures below show the real plan solution with the more refined HTab parameters and the resulting profile plot. Notice the HTab curves are squeezed to a narrower range, providing more resolution. The difference in the solution on the profile plot is subtle, but makes all the difference between a stable and unstable solution at this bridge.
Comments
Anonymous
on June 21, 2011Good info
SS
on December 6, 2011that is really helpful. But I still have some problems in model bridge. I got all the elevation data for all cross section from dem, useing hec-georas. When I try to set up a bridge in hecras, and I need to add a new cross section just down stream at the bridge cross section. But whenever I try to copy a corss section or add a new cross section, the river lenth will be automaticlly extended. For example, I have 7 cross sections on a 300m river section, they are away from each other in 50m. When I try to add a cross section at 20m (from the lowest cross section), the river section become 350m, not 300m, I do not why… Is there anyone who has the similar experience? Thank you for your attention.
Chris G.
on December 12, 2011It sounds like you need to adjust the reach lengths of the cross sections when you copy the new one in. Keep in mind that RAS positions cross sections relative to each other by their respective reach lengths, not the river stationing. The river stationing does not provide spatiality to the cross sections, it is only used to order them from downstream to upstream.
Add Your Comment